Repository Metrics
Code quality isn't solely determined by the issues that are directly present in your source code. Many hidden statistics and figures can impact your code's performance and accessibility to other developers.
DeepSource analysis not only identifies code-specific issues in your codebase but also calculates essential metrics that determine various aspects of your code's quality. These key metrics are displayed in the Metrics tab, providing you with valuable insights into your code's overall health.
Available metrics
| Code | Name | Description |
|---|---|---|
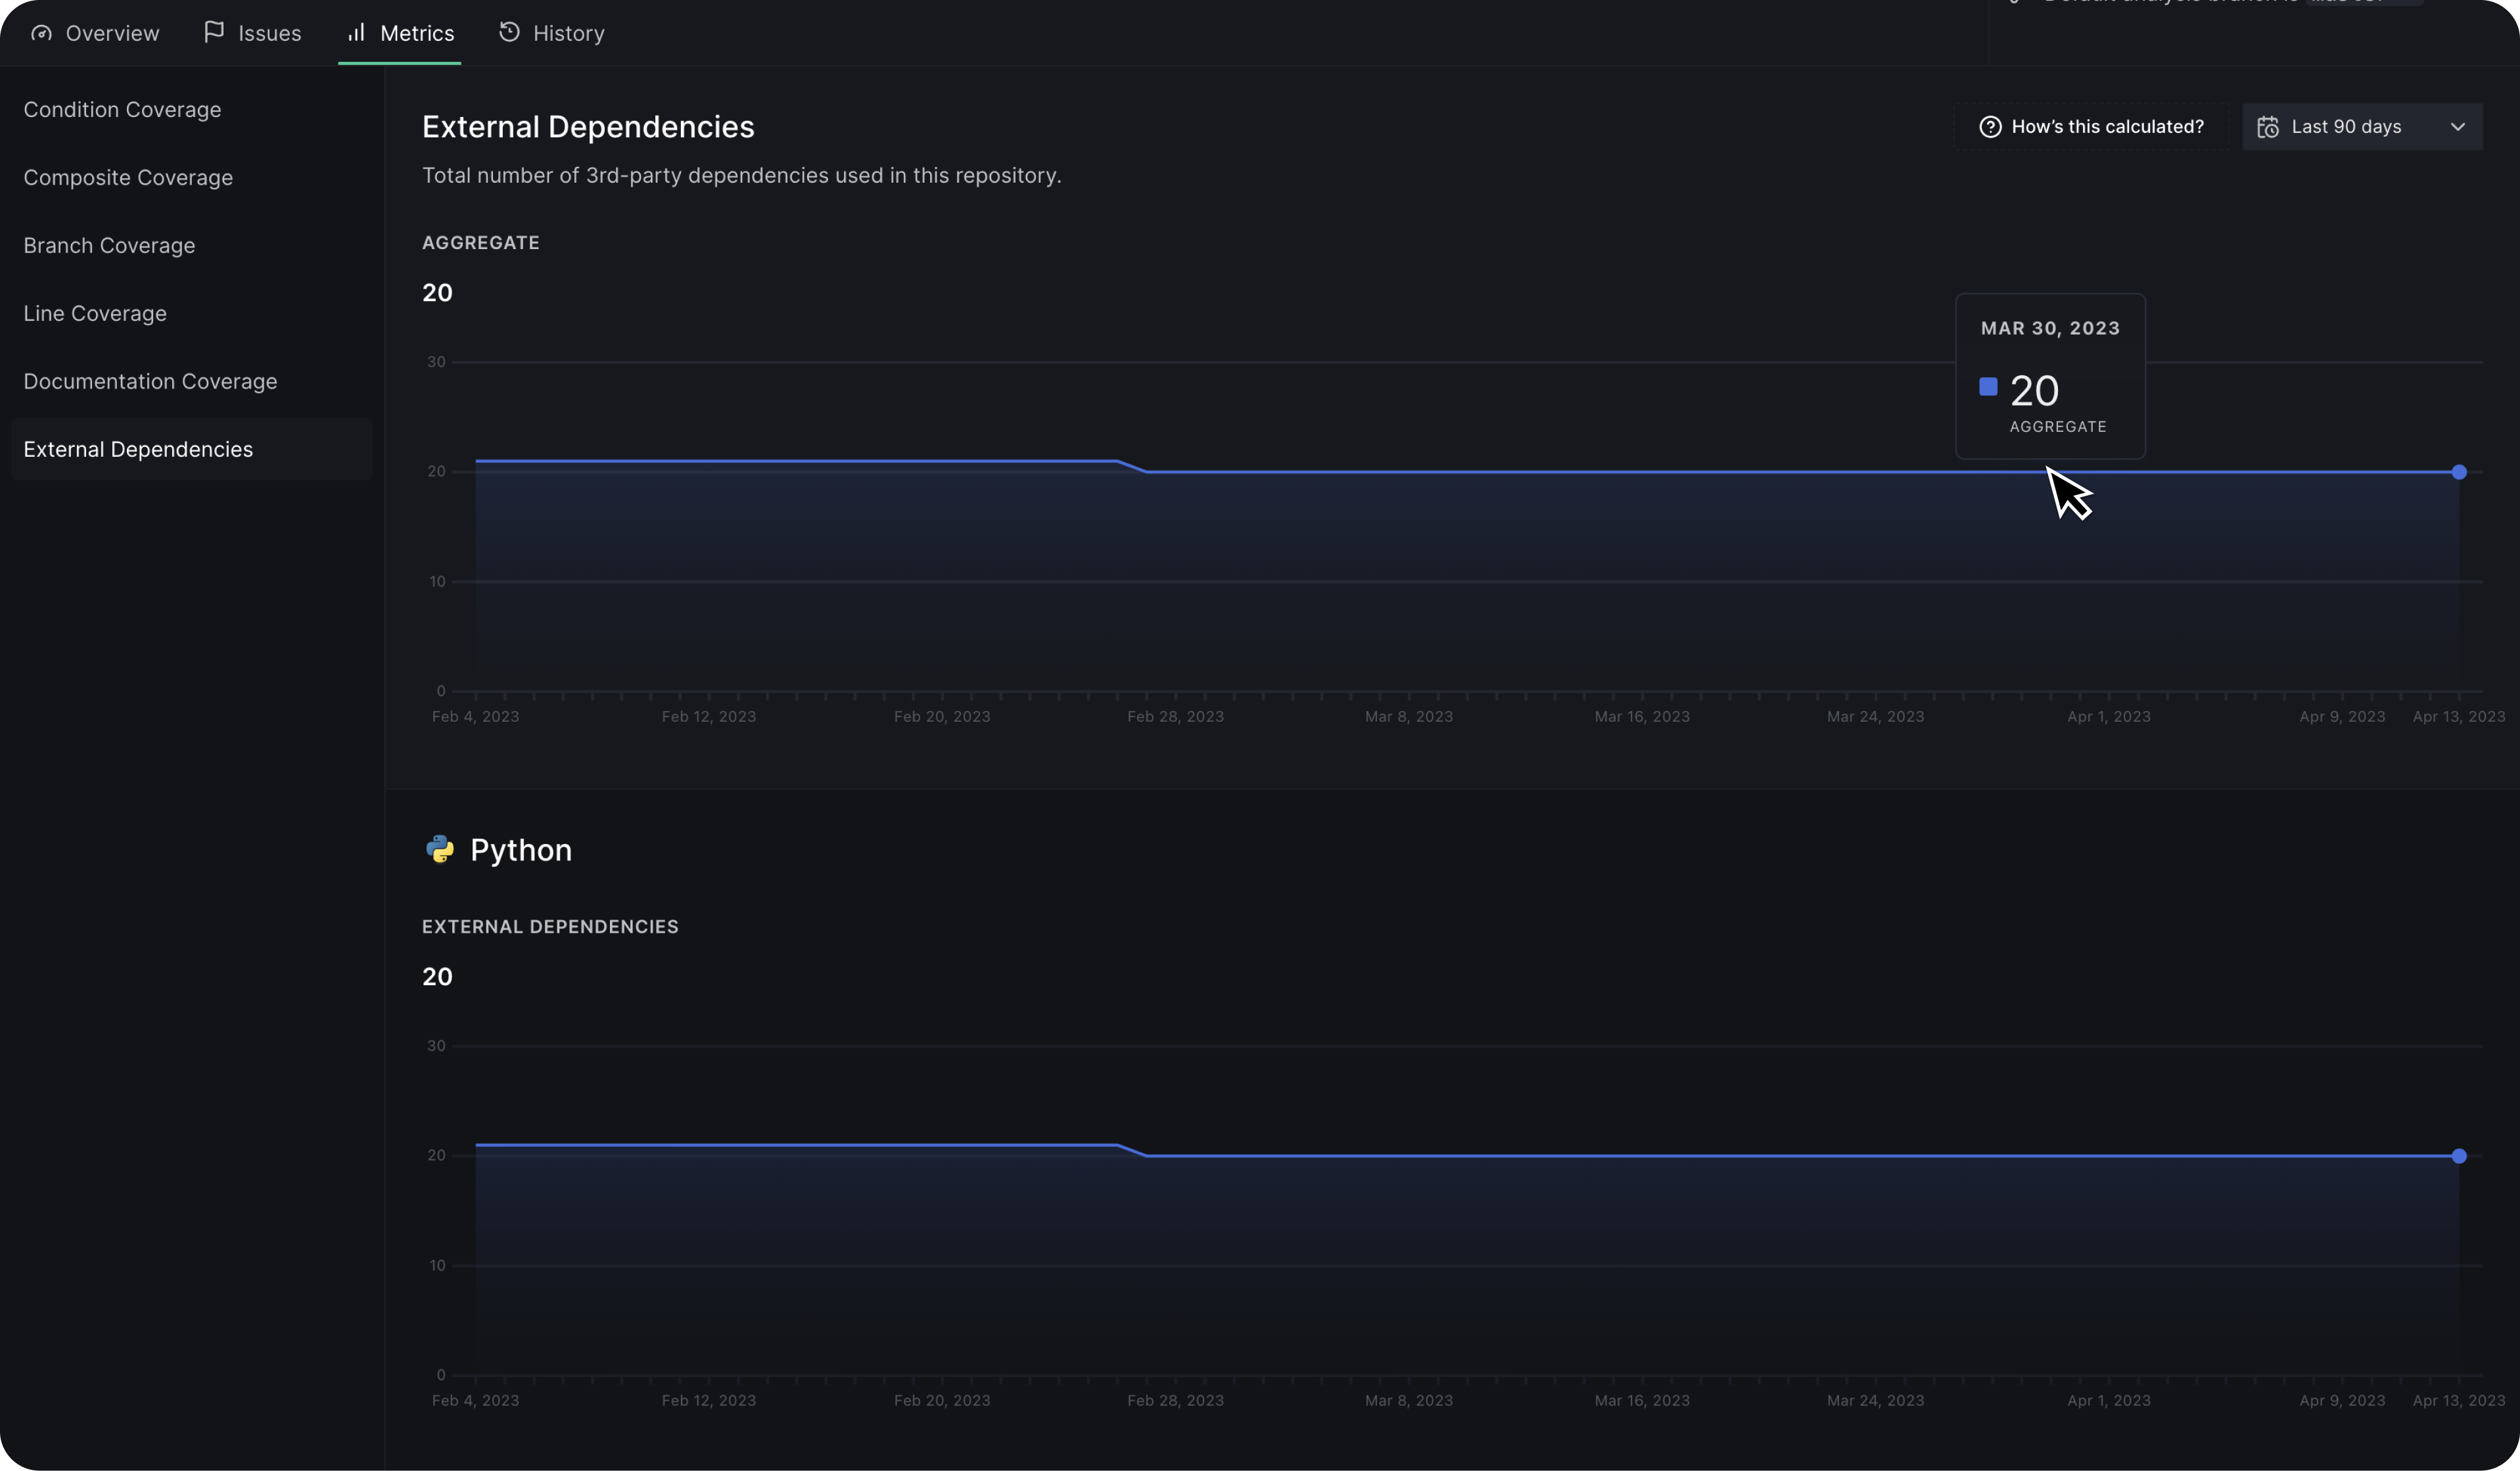
| DDP | External Dependencies | Total number of 3rd-party dependencies used in this repository |
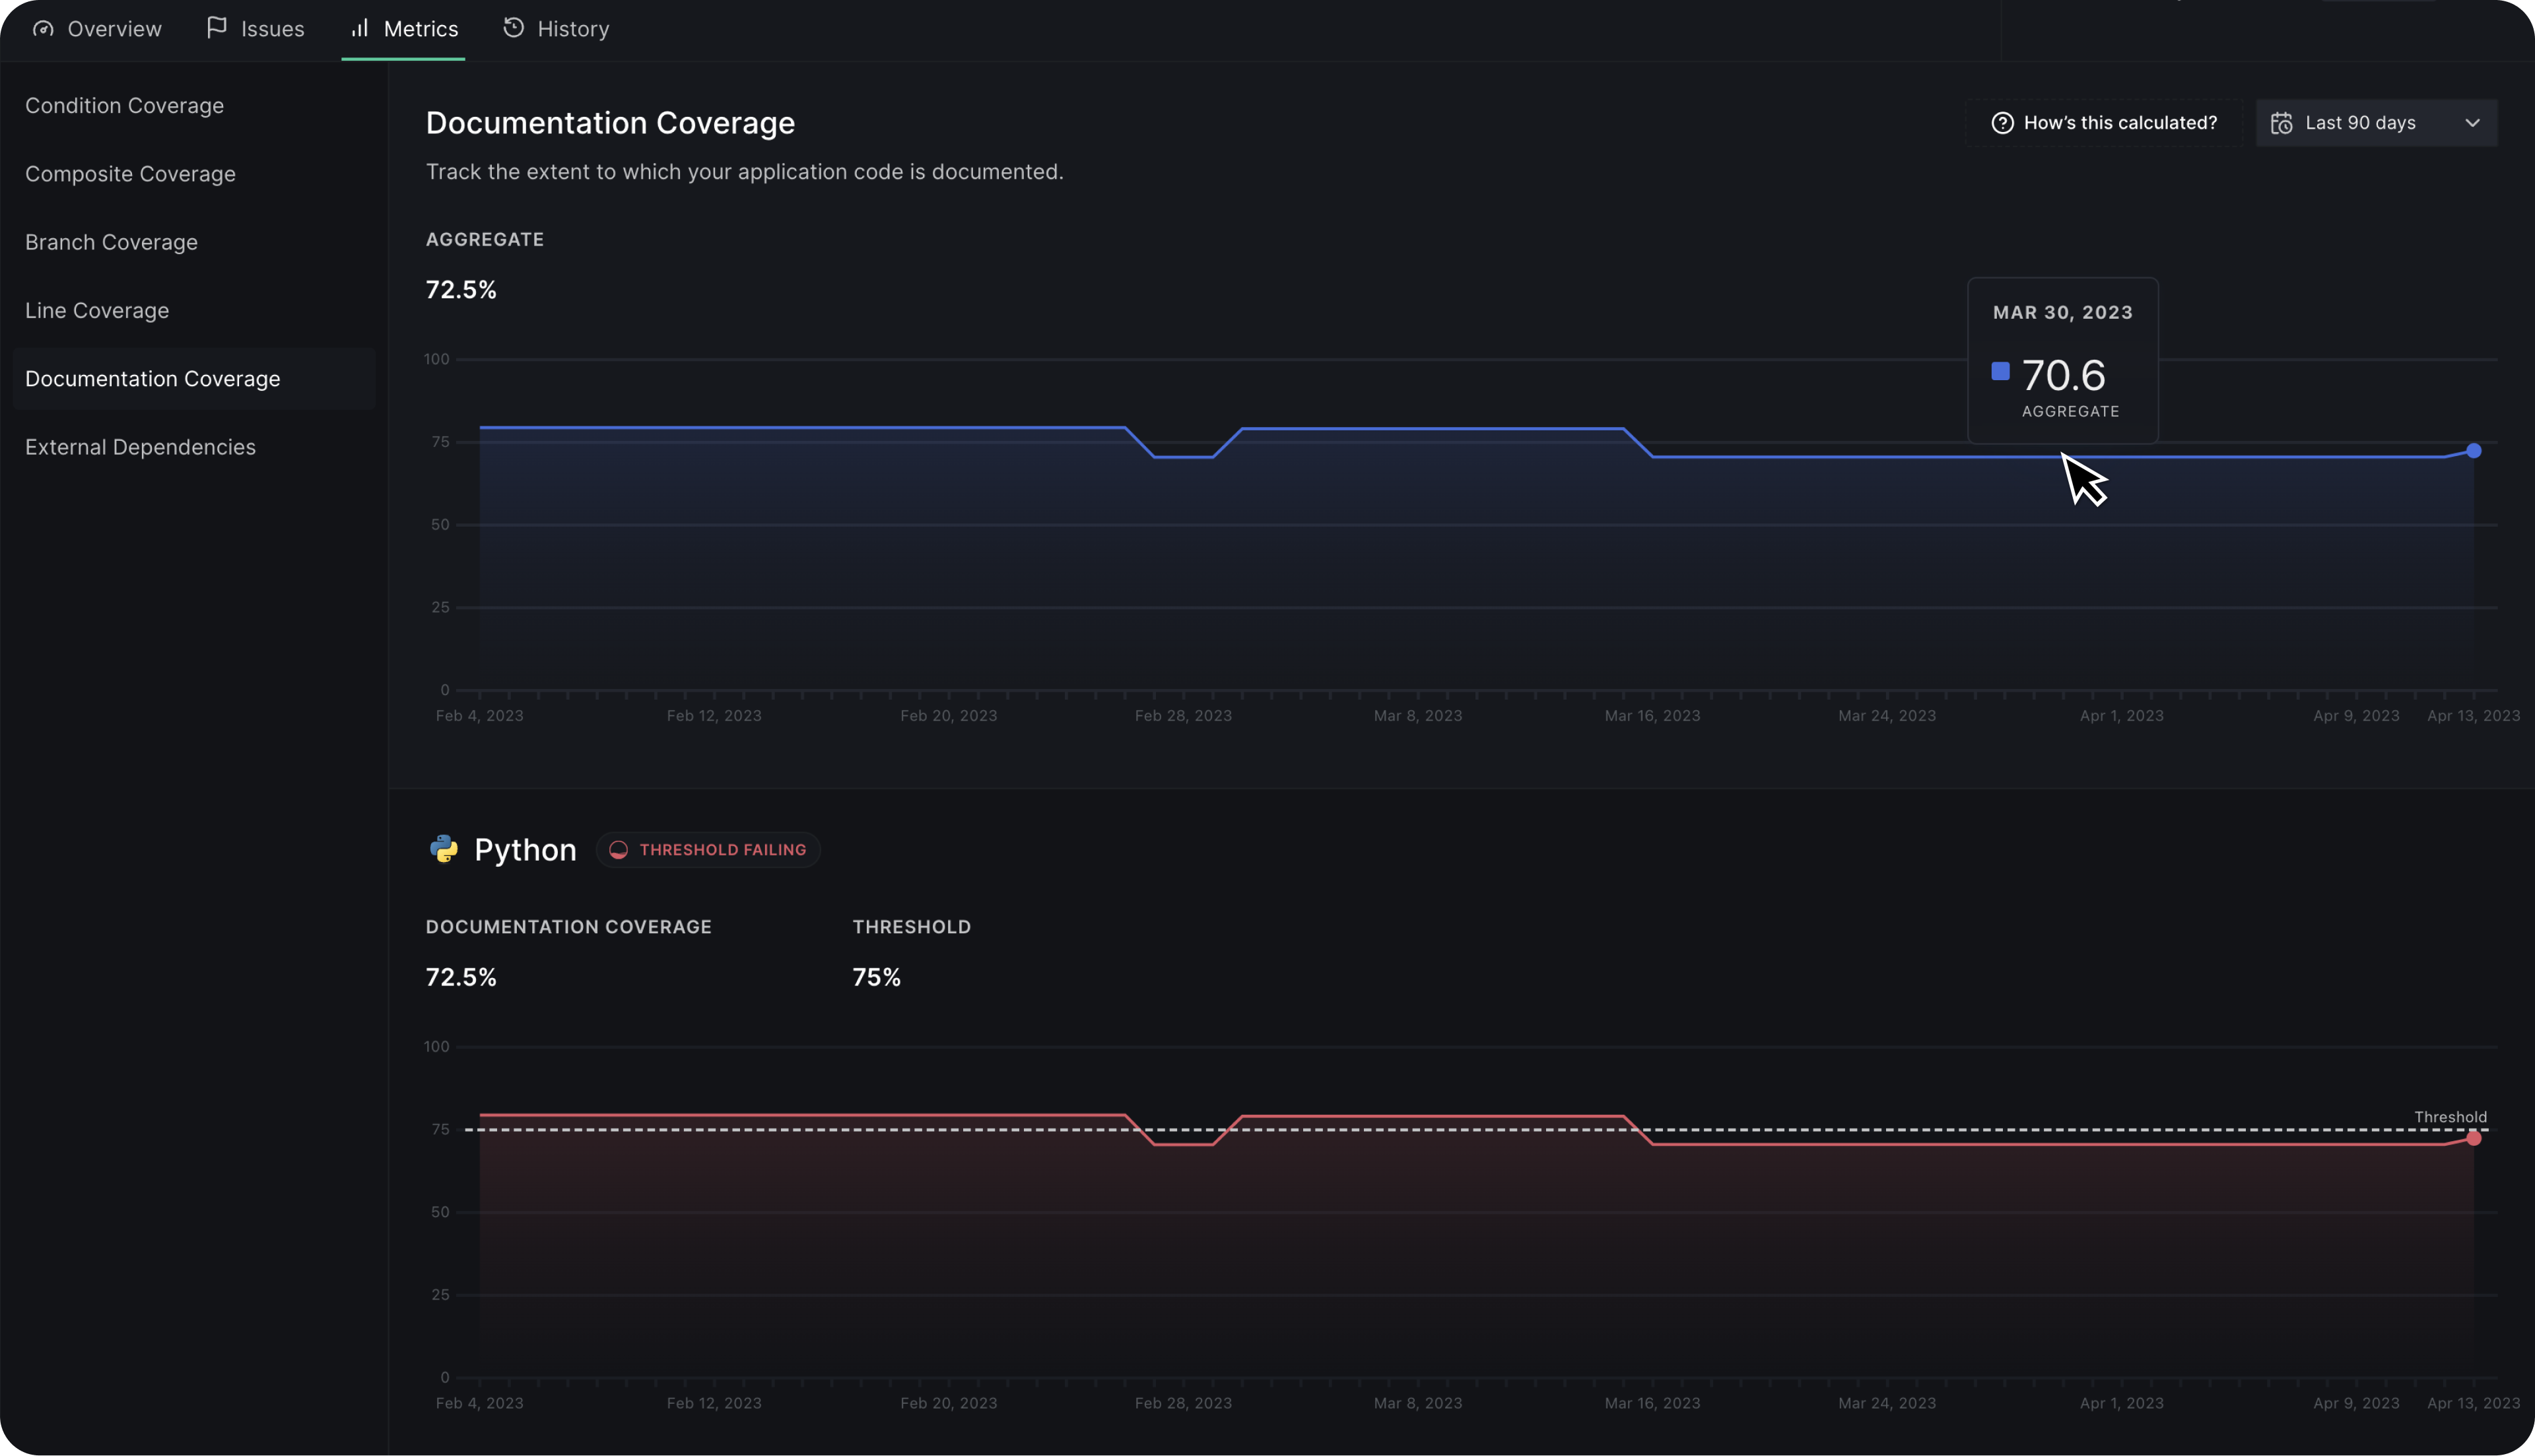
| DCV | Documentation Coverage | Track the extent to which your application code is documented |
| LCV | Line Coverage | Line coverage of the default branch of the repository |
| BCV | Branch Coverage | Branch coverage of the default branch of the repository |
| CCV | Condition Coverage | Percentage of logical conditions covered in the default branch of the repository |
| CPCV | Composite Coverage | Weighted average of the coverage of lines, conditions, and branches executed by the tests |
| NLCV | New Line Coverage | Percentage of lines in the source code covered by tests in the changeset |
| NBCV | New Branch Coverage | Percentage of branches in the source code covered by tests in the changeset |
| NCCV | New Condition Coverage | Percentage of logical conditions in the source code covered by tests in the changeset |
| NCPCV | New Composite Coverage | Weighted average of line, condition and branch coverage executed by tests in the changeset |
Metric charts
Metrics are displayed on a chart as a trend line over time, indicating if they are above or below a threshold. Each metric is reported per analyzer, and some metrics are also aggregated across analyzers using logic explained in the documentation.
By selecting a metric, you can view its plot of value variations and adjust the duration of the displayed stats to 30, 60, or 90 days. You can also modify the allowed threshold value or remove it entirely by clicking on the options icon next to the current threshold value.
In the "Metrics" tab, a trend is shown only for first-level metrics and not for the changeset-only metrics
Metric aggregate calculation
If a metric is measured for multiple languages, an aggregate value is calculated. The aggregate value is determined by one of three logic types for each metric:
| Type | Used by | Description |
|---|---|---|
| Sum | DDP | Calculated as a summation of the metric's values captured for all languages reported in an Analysis run |
| Average | DCV | Calculated as an arithmetic mean of the metric's values captured for all languages reported in an Analysis run |
| Weighted Average | LCV, BCV, CCV, CPCV, NLCV, NBCV, NCCV, NCPCV | Calculated as a weighted arithmetic mean of the metric's values captured for all languages reported in an Analysis run but taking into account each language's weight fraction in the repository |
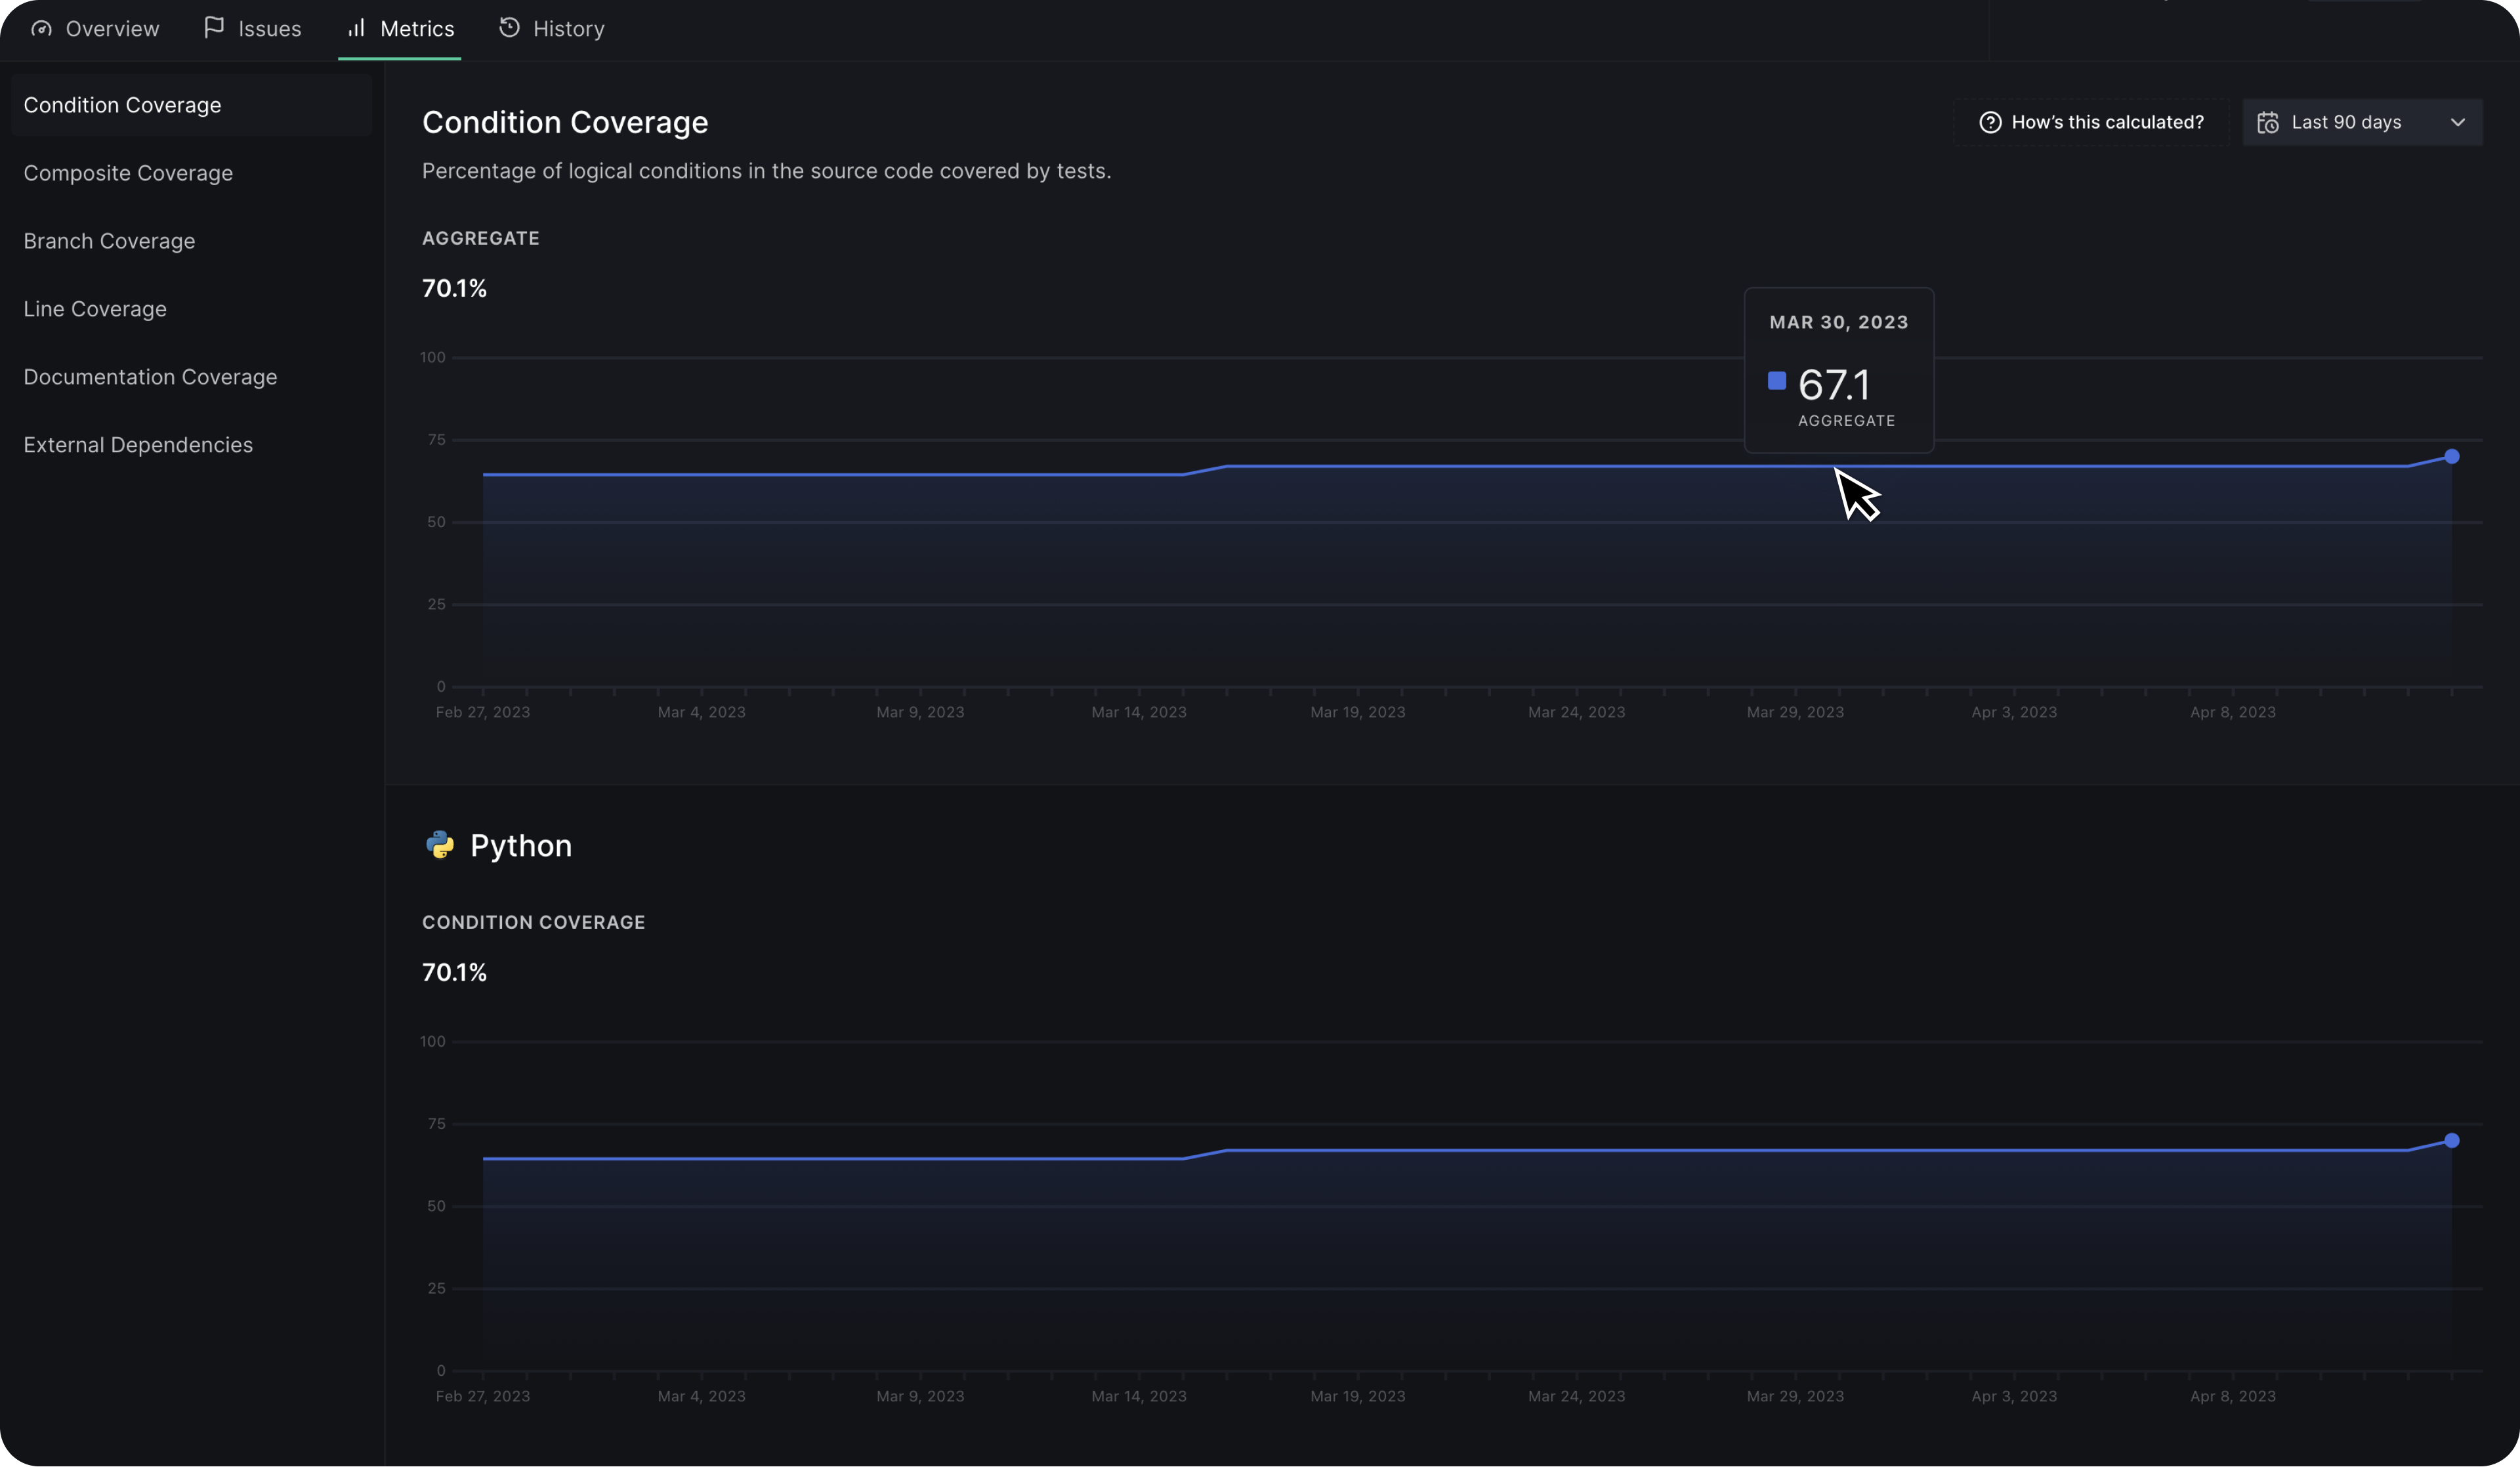
Condition coverage
Condition coverage refers to the proportion of logical conditions in the source code that are covered by tests, expressed as a percentage.
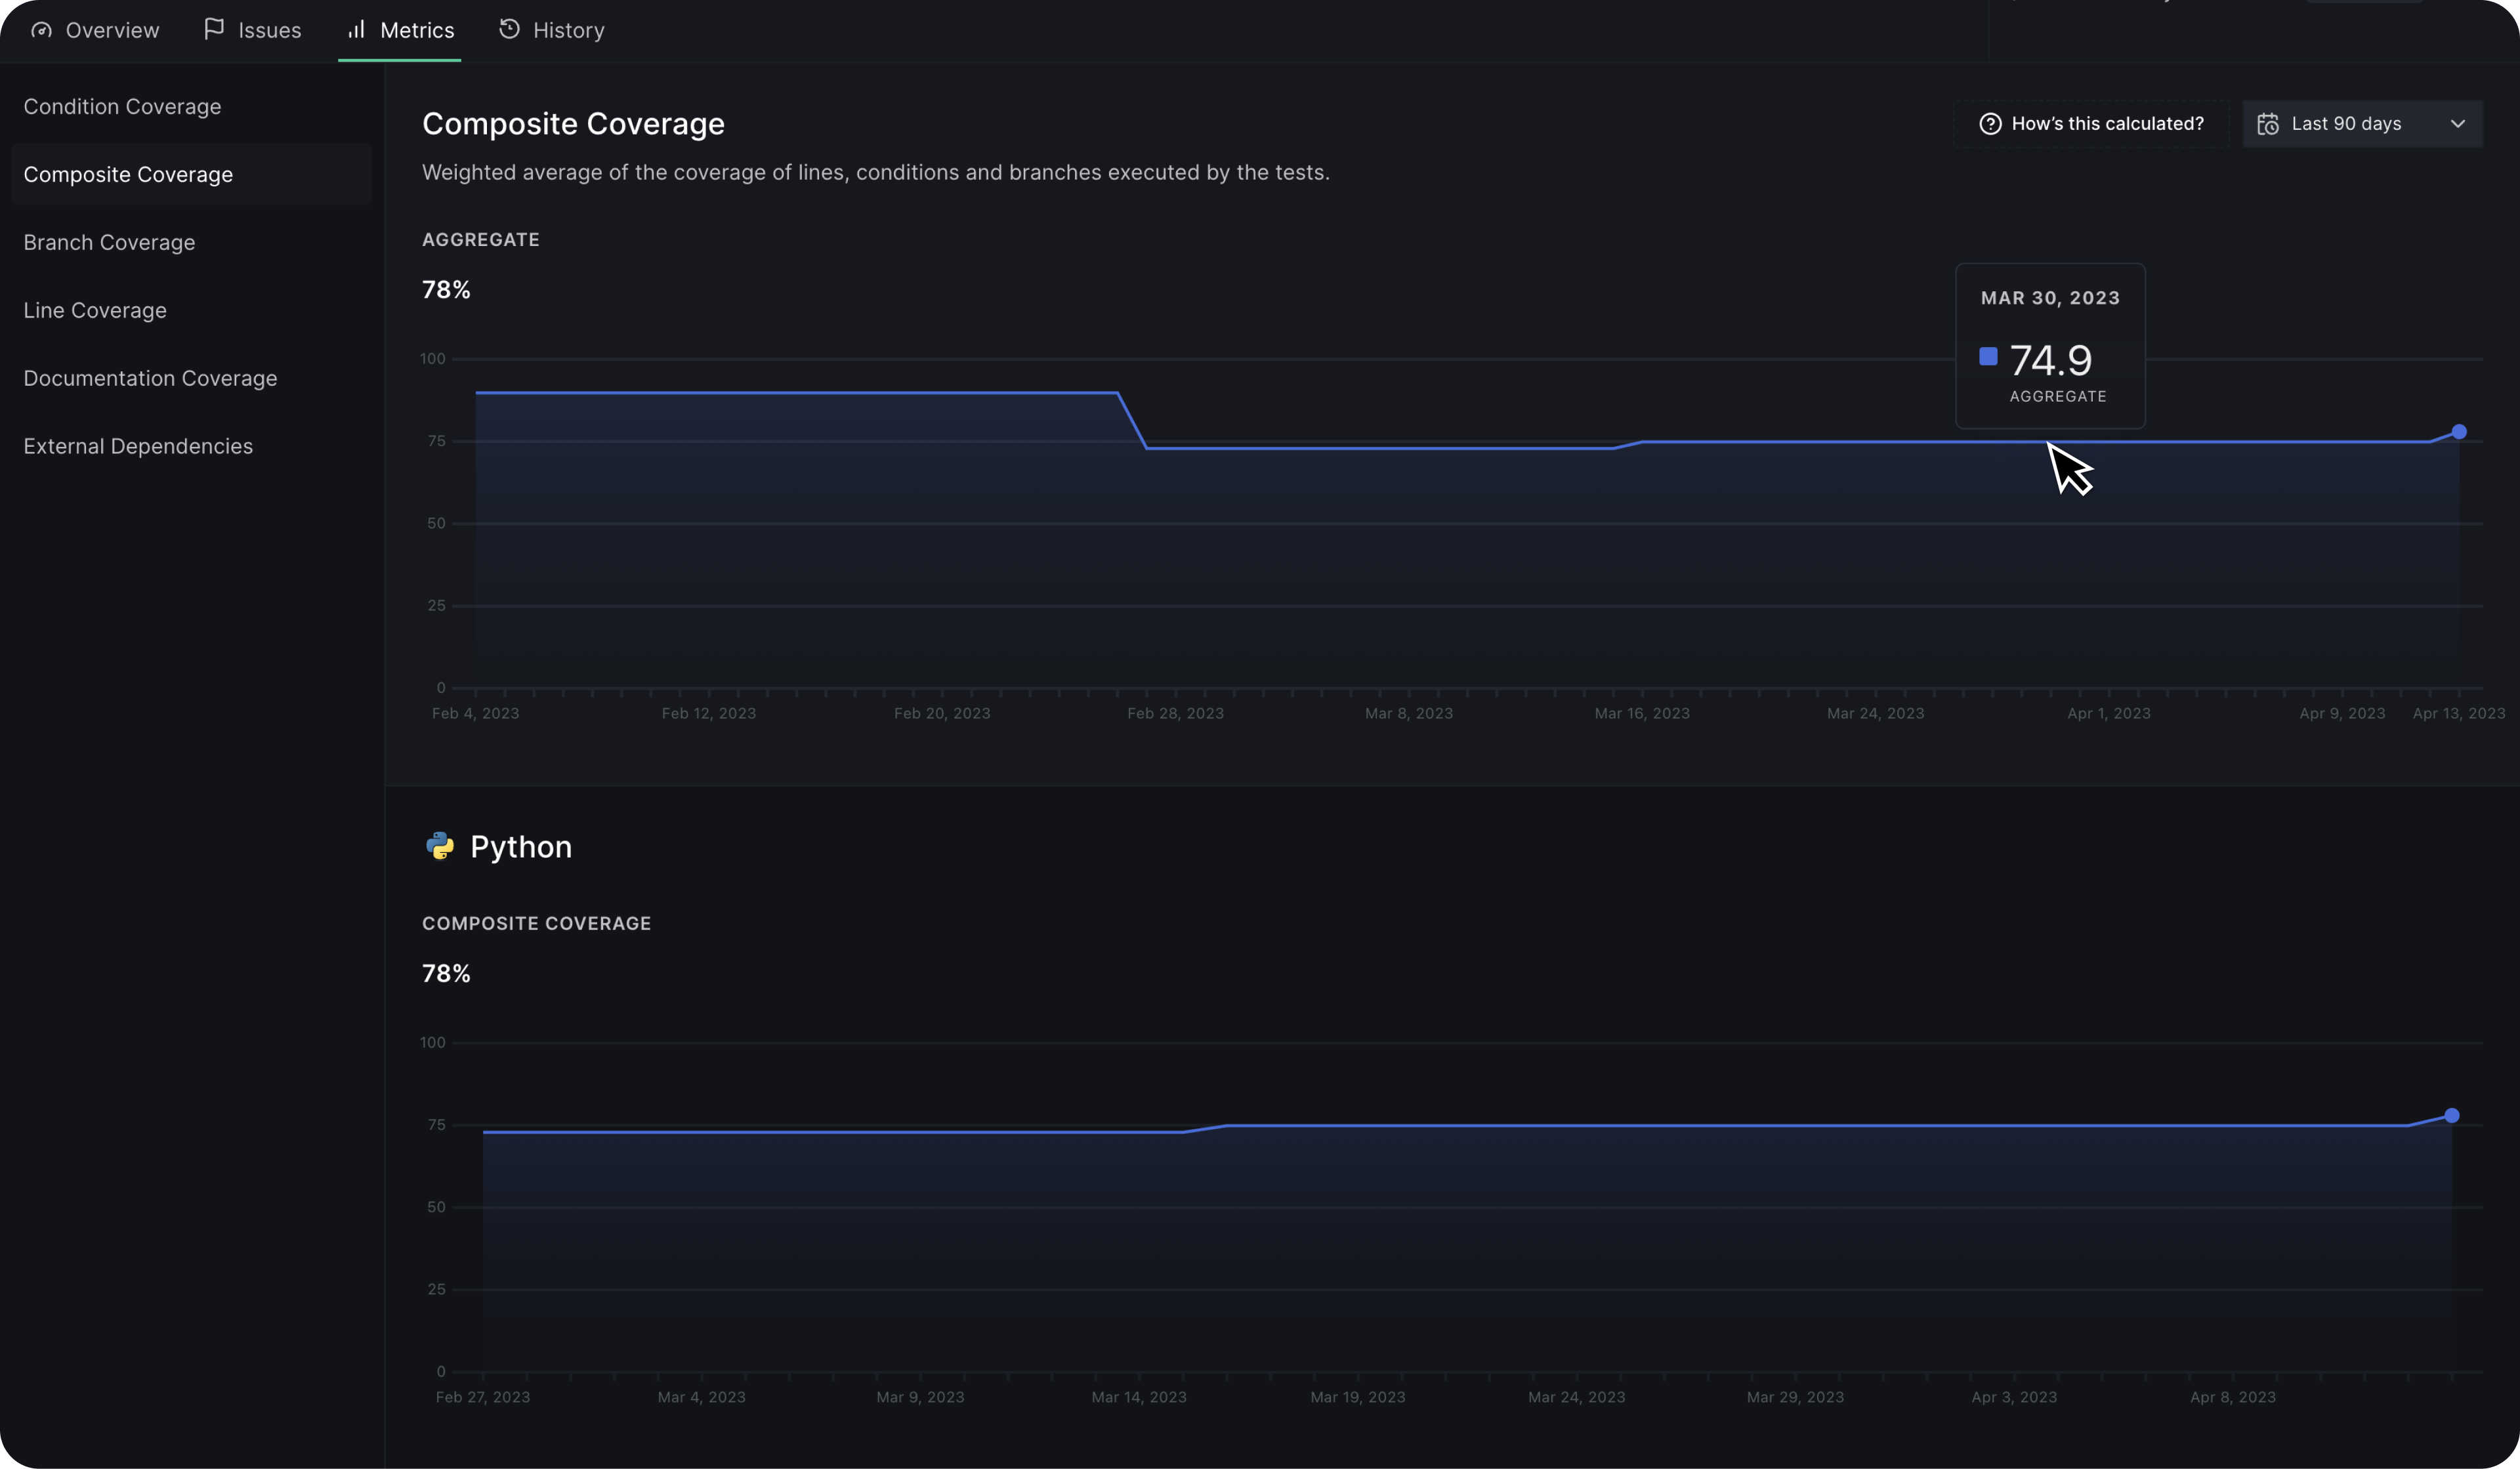
Composite coverage
Composite coverage is a metric that calculates the weighted average of the coverage of executed lines, conditions, and branches by the tests in the source code.
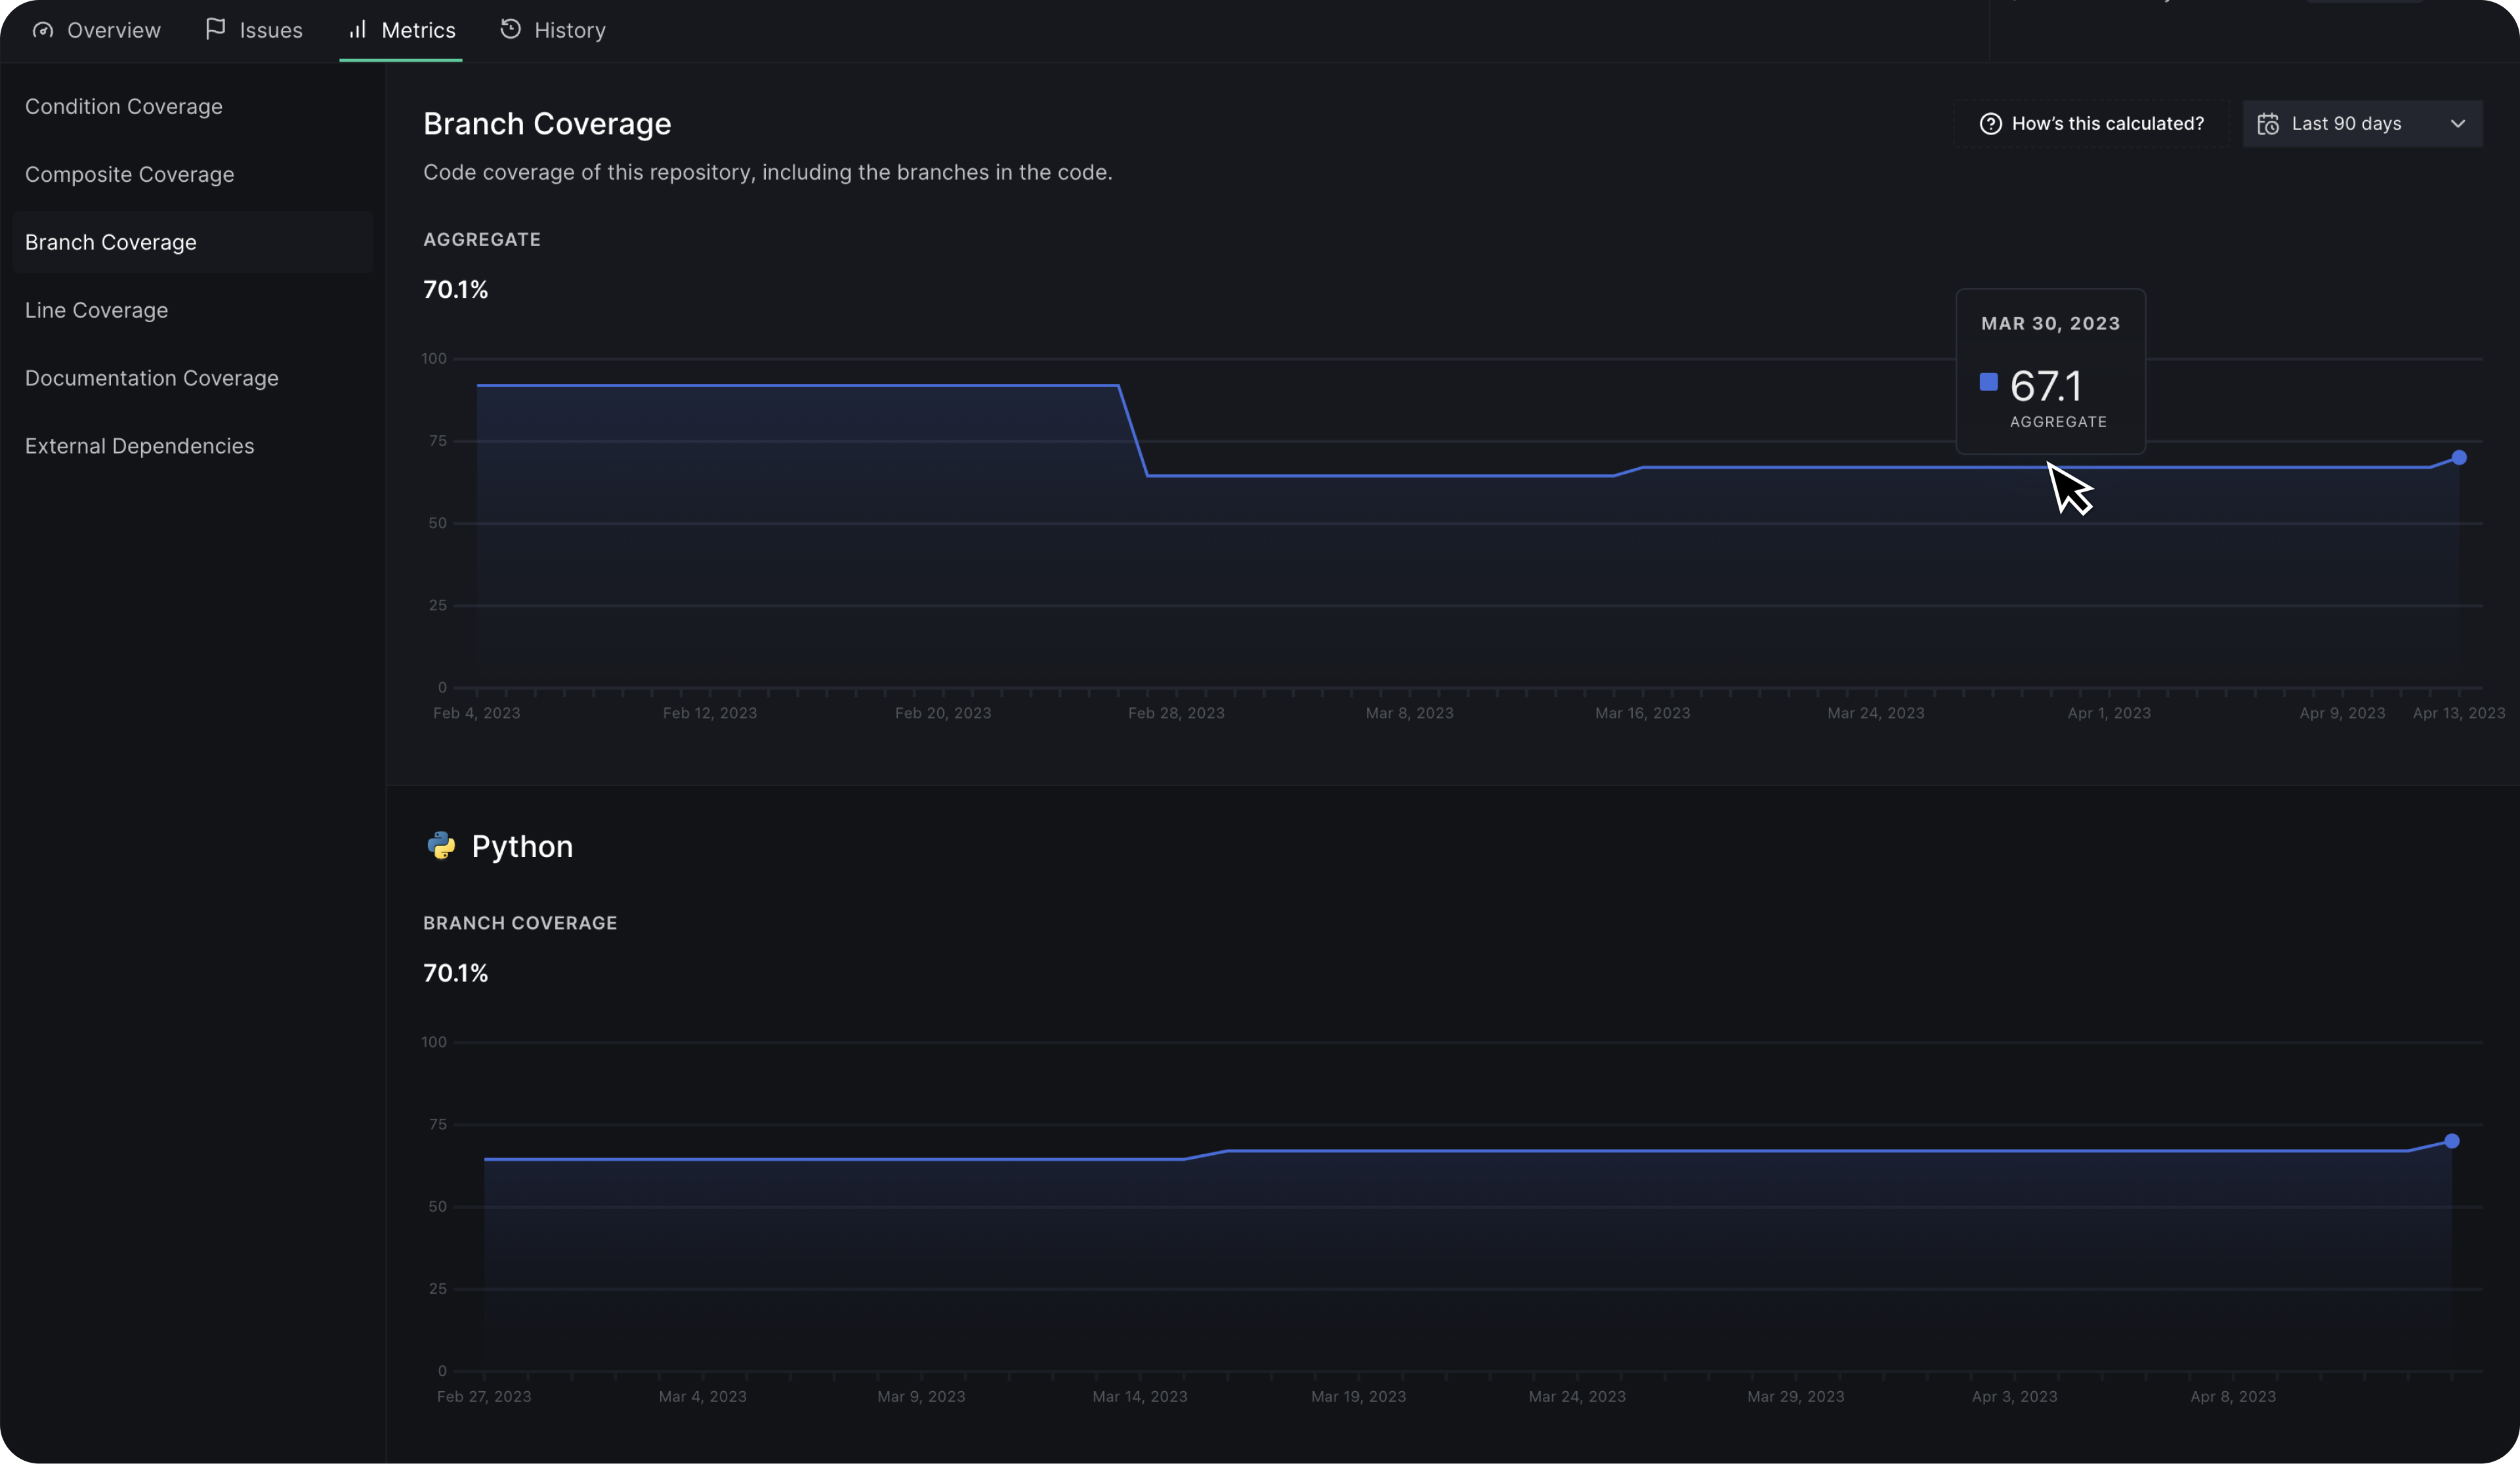
Branch coverage
Branch coverage is a measure of code coverage in a repository that includes the branches present in the code.
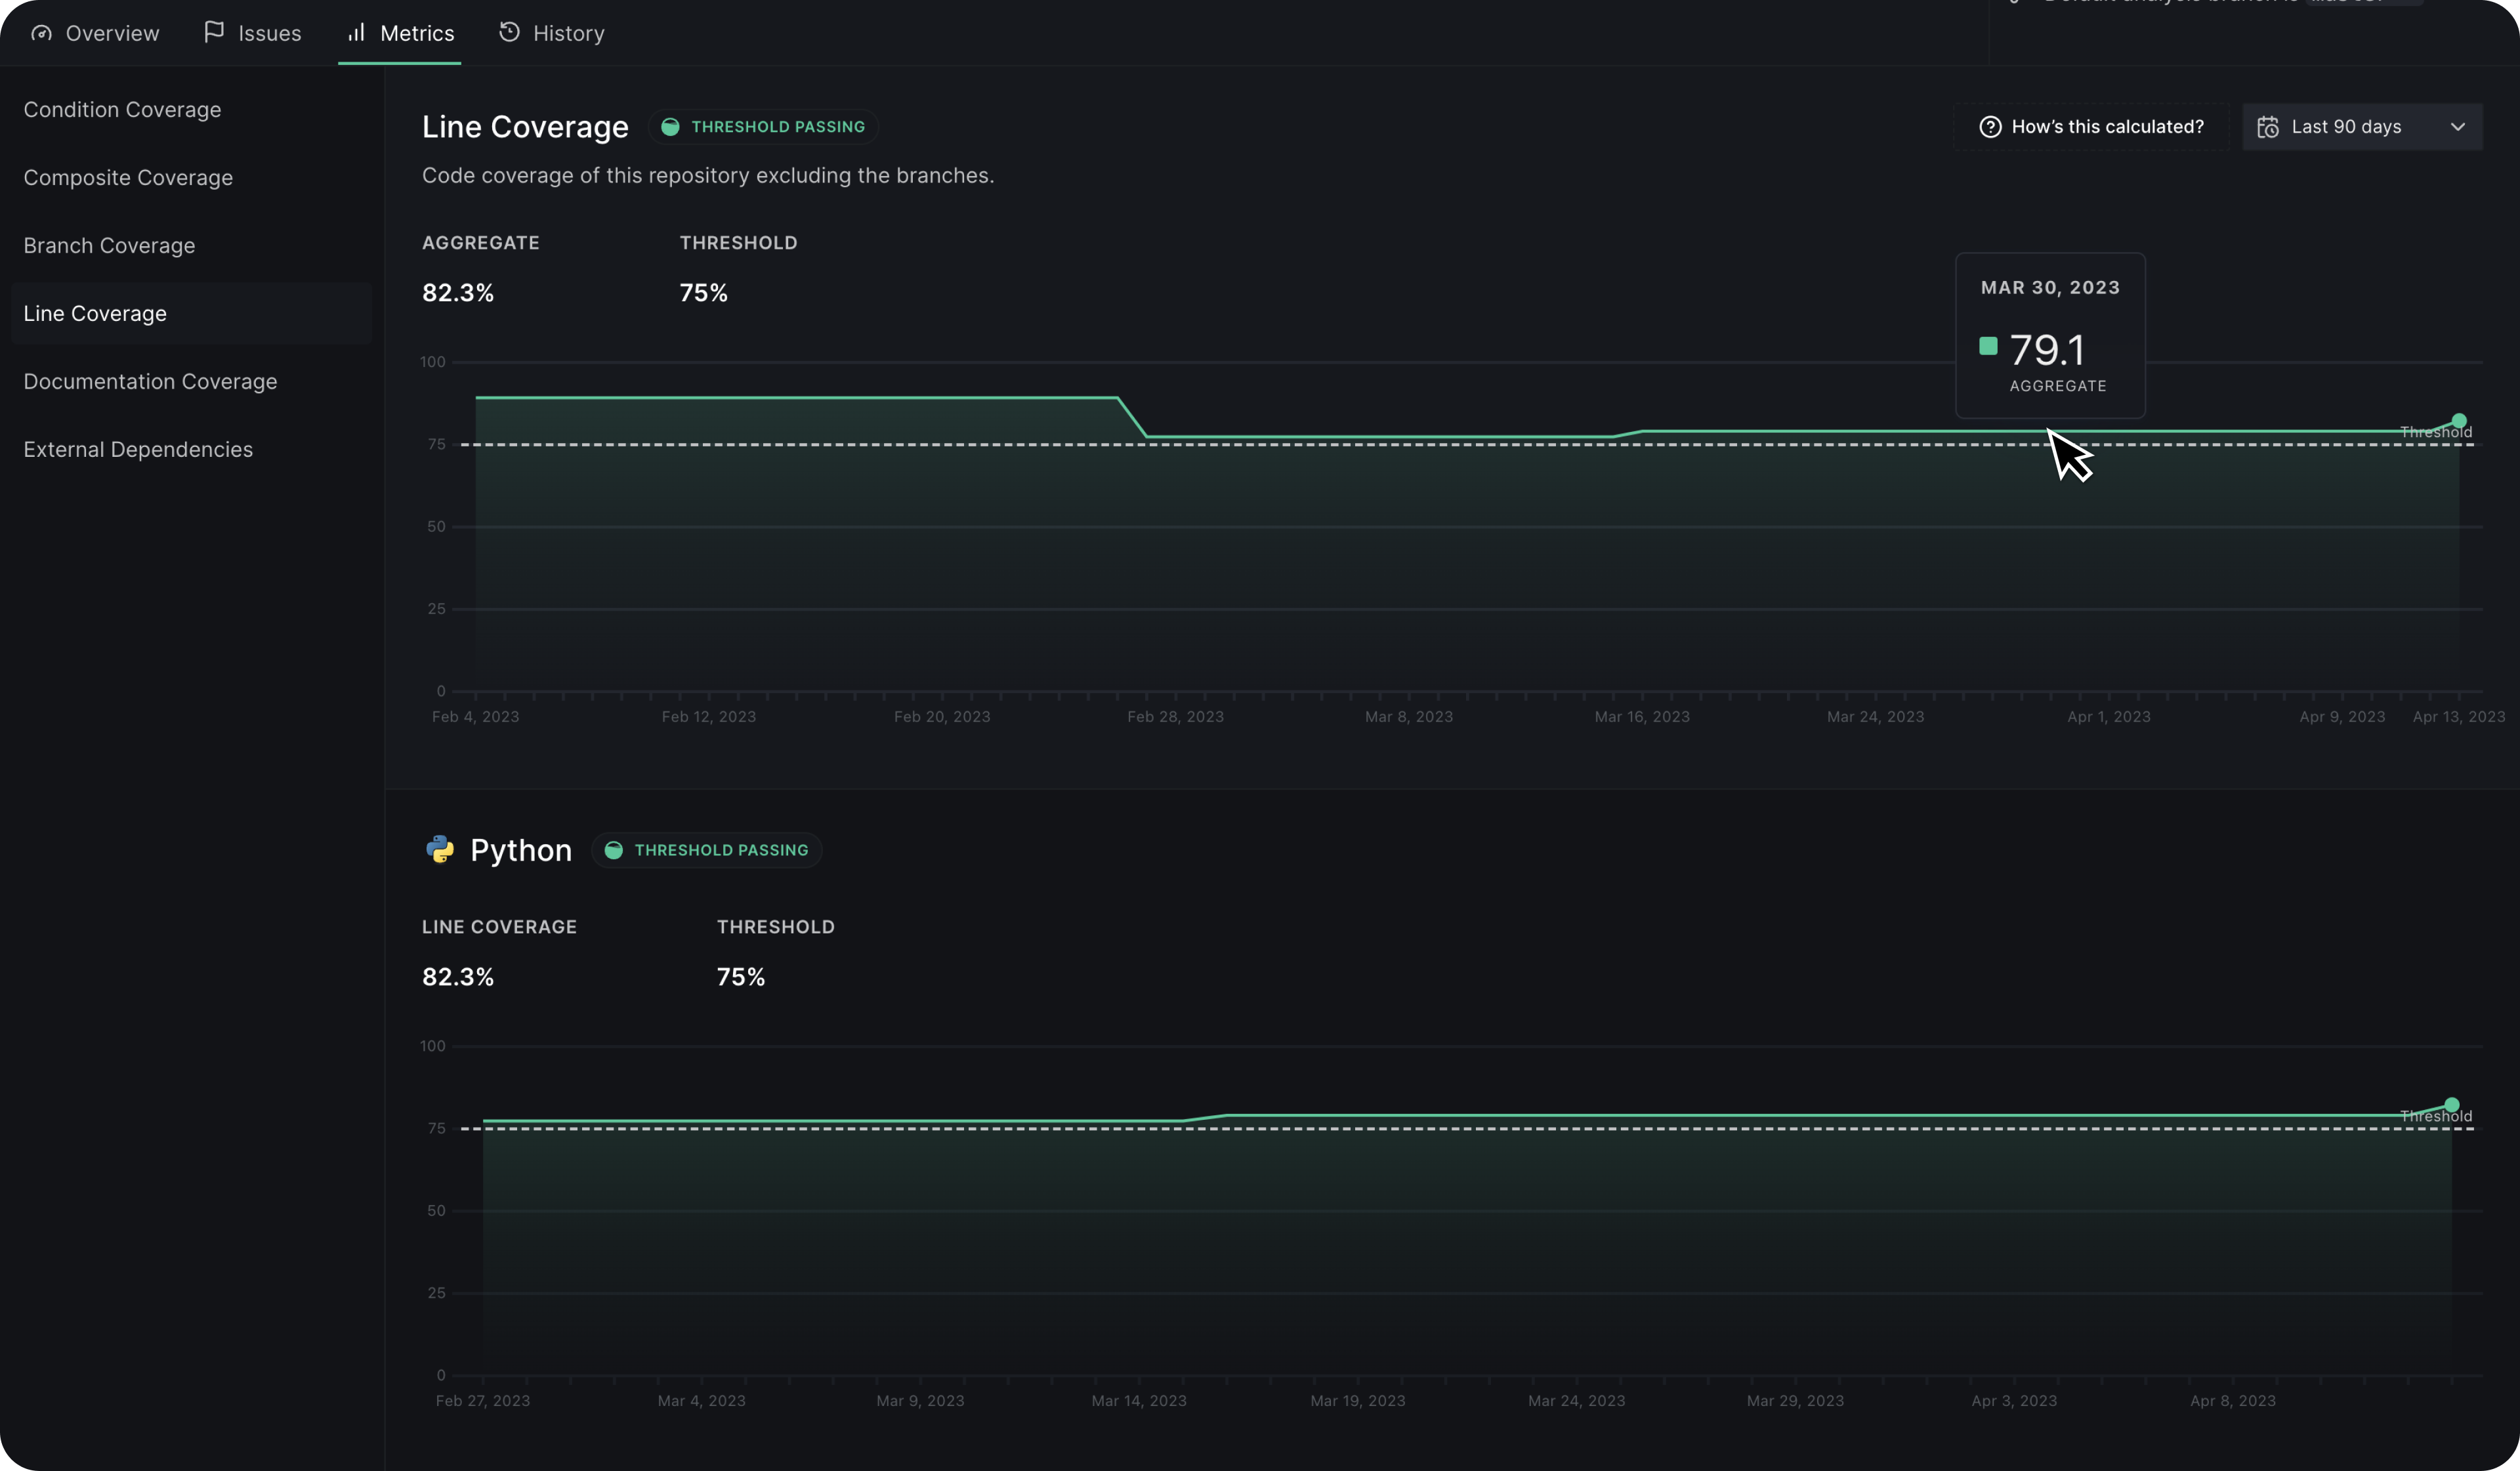
Line coverage
Line coverage is a measure of code coverage in a repository that excludes the branches in the code.
Documentation coverage
Documentation coverage measures the degree to which your application code is documented, allowing you to track and improve the comprehensiveness of your code documentation.
External dependencies
The External Dependencies metric denotes the overall count of third-party dependencies employed in the repository.
Updated 3 months ago